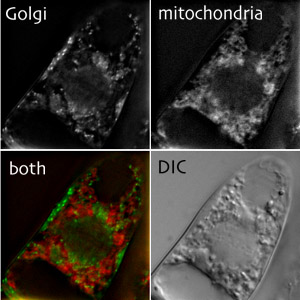
- confocal images
- Golgi movement
- Golgi distribution
- > Golgi & cytokinesis
- Golgi & cytoskeleton
- Brefeldin A
- Golgi movement
Golgi stacks during cytokinesis
For more information see our publication.
Time-lapse sequence of a single cell going through cytokinesis. The left half shows the GFP fluorescence, the right half the corresponding DIC image. Images were taken in 30 s intervals (see time stamp in upper right corner) starting in late anaphase and ending with the completion of the cell plate. Golgi stacks show a dynamic association with the phragmoplast at all stages.
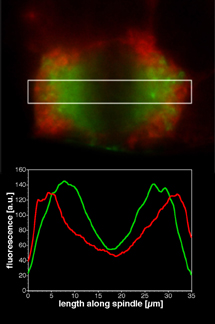
Comparison of the distribution of Golgi stacks and mitochondria and plastids (stained with MitoTracker) at metaphase. Golgi stacks tend to accumulate closer to the mitotic spindle than mitochondria and plastids (see fluorescence profile).
Another cell at metaphase, with a nice demonstration of the "Golgi belt" (see also 3D video on the Golgi distribution page).